Want to predict game outcomes more accurately? Start by focusing on advanced metrics and AI tools. Traditional stats like wins and losses only scratch the surface. Modern methods dive deeper into team performance, player impact, and real-time game dynamics. Here’s a quick look at what matters most:
- Key Metrics: Points Per Possession (PPP), Team Ratings (Offensive, Defensive, Net), and Four Success Factors (eFG%, Turnover Rate, Offensive Rebounding %, Free Throw Rate).
- Player Impact: Metrics like PER, Win Shares, BPM, and VORP reveal individual contributions.
- AI Tools: Platforms like betGPT analyze real-time data, track line movements, and identify betting opportunities.
How to use these insights: Combine pre-game analysis, live updates, and AI-driven predictions to refine your strategy and make smarter decisions. This article breaks it all down for you step by step.
How I Would Learn Sports Analytics
Top Game Prediction Metrics
Metrics like Points Per Possession (PPP), team performance ratings, and key success factors offer a deeper look into game dynamics. These go beyond basic stats, revealing trends in efficiency and potential opportunities for bettors and analysts alike.
Points Per Possession (PPP)
PPP evaluates scoring efficiency by dividing total points by possessions. On defense, limiting an opponent's PPP is just as important as maximizing it on offense. While individual efficiency is crucial, team ratings provide a more comprehensive view of overall performance.
Team Performance Ratings
Team ratings merge offensive, defensive, and net performance data to give a clearer picture of a team's strengths and weaknesses:
| Rating Type | Key Components | Predictive Value |
|---|---|---|
| Offensive Rating | Points per 100 possessions, shooting accuracy, turnovers | Strongly linked to win probability |
| Defensive Rating | Opponent points per 100 possessions, blocks, steals | Reflects defensive control and impact |
| Net Rating | Difference between offensive and defensive ratings | Offers a full view of team performance |
Breaking these down further reveals the core factors that drive success in basketball.
Four Key Basketball Success Factors
- Effective Field Goal Percentage (eFG%): Accounts for the extra value of three-point shots. Better shooting efficiency leads to stronger overall performance.
- Turnover Rate: Tracks how well a team protects the ball. Fewer turnovers often mean a higher chance of winning.
- Offensive Rebounding Percentage: Measures how effectively a team grabs offensive rebounds, creating additional scoring opportunities.
- Free Throw Rate: Shows how often a team draws fouls and converts free throws, adding crucial points.
sbb-itb-4dab2a2
Player Performance Metrics
Individual performance data provides deeper insights into game outcomes, complementing team-level metrics. These player-specific stats help highlight how athletes influence results and refine the overall analysis.
PER and Win Shares Explained
Player Efficiency Rating (PER) simplifies performance into a single number, making it easier to compare players across different positions. A PER of 15.0 represents the league average, while scores above 25.0 indicate top-tier players. Win Shares, on the other hand, estimate the number of wins a player directly contributes to their team.
| Metric | Scale | Interpretation | Predictive Value |
|---|---|---|---|
| PER | 0–30+ | <15: Below Average; 15–20: Solid Starter; >25: Superstar | High for individual impact |
| Win Shares | 0–15+ | <2: Role Player; 5–8: All-Star Level; >10: MVP Candidate | Strong for assessing team success |
BPM and VORP Analysis
Box Plus/Minus (BPM) evaluates a player's contribution in points above or below the league average per 100 possessions. Value Over Replacement Player (VORP) translates this into a season-long metric, comparing a player's value to that of a replacement-level player.
These metrics are particularly useful for their ability to account for game pace, positional roles, and team quality. By combining these individual stats with team-level data, you can develop a more complete and effective betting strategy.
Sports Betting Tools and Software
Software processes massive data sets in real-time, improving the accuracy of predictions.
betGPT Features and Uses
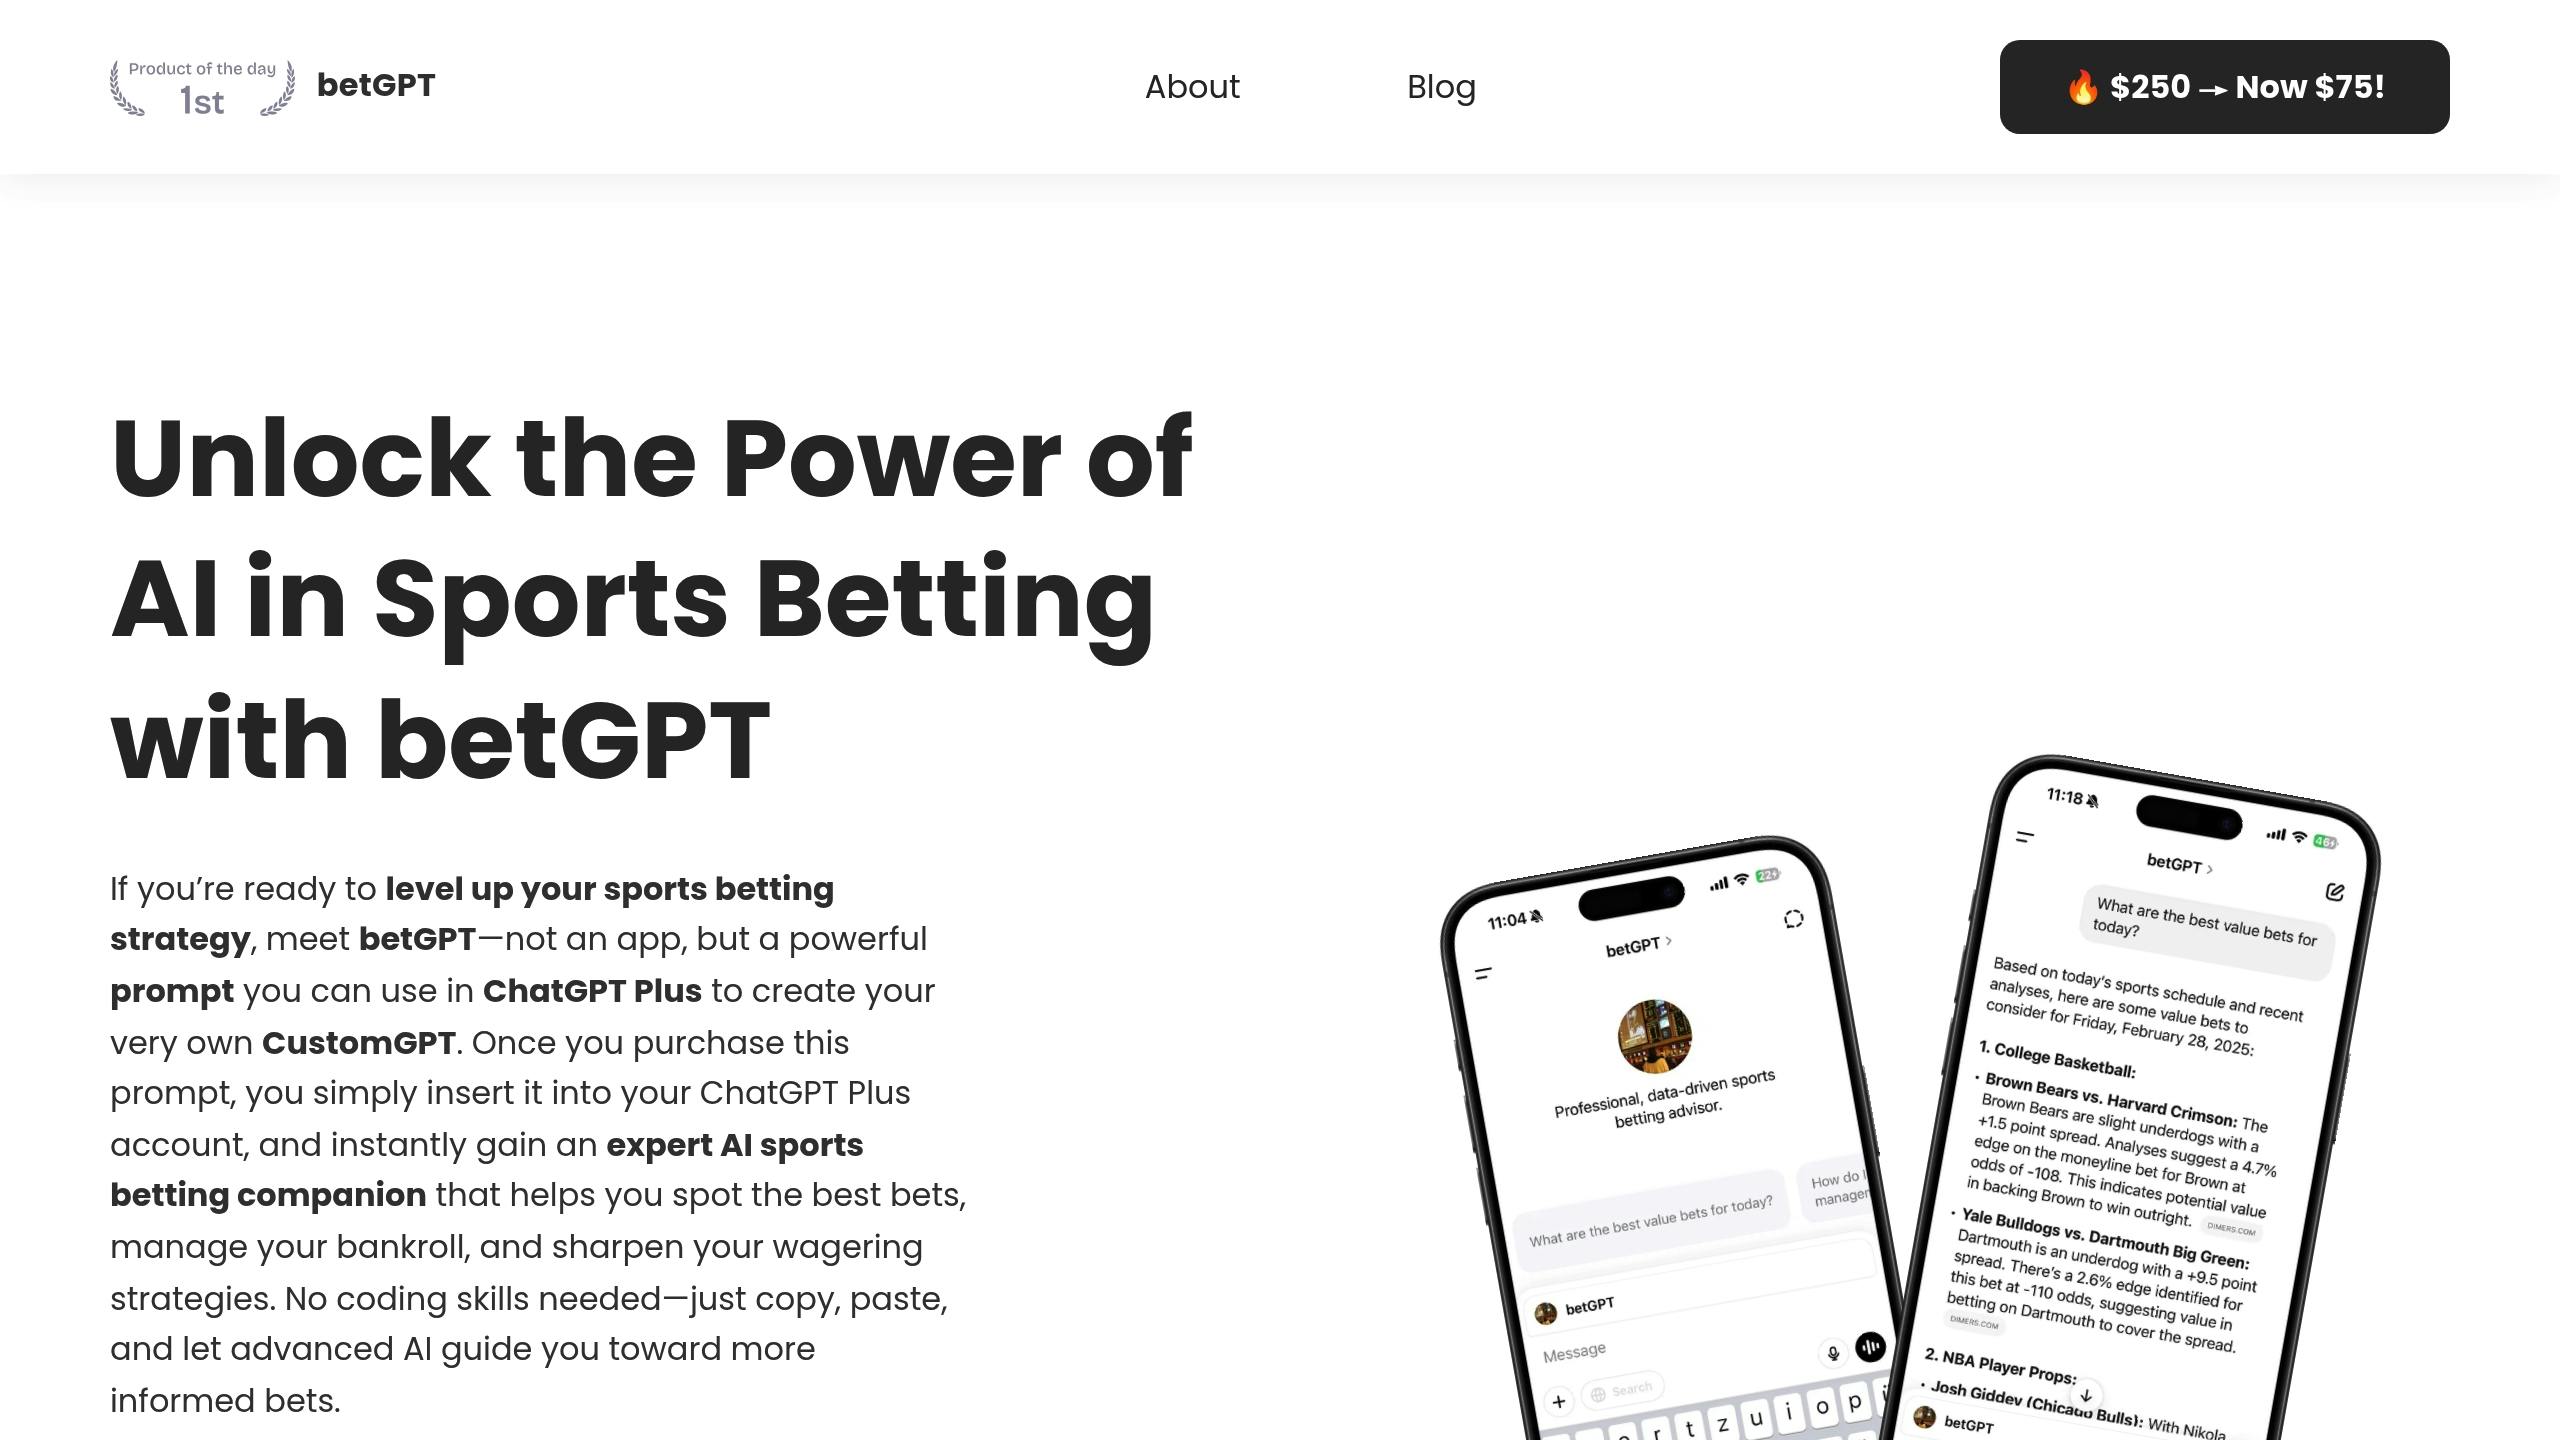
betGPT leverages AI through ChatGPT Plus to deliver detailed betting insights.
| Feature | Function | Benefit |
|---|---|---|
| Value Detection | Compares odds across sportsbooks | Highlights profitable betting opportunities |
| Line Movement Analysis | Tracks real-time odds changes | Uncovers market trends and sharp money |
| Multi-Sport Coverage | Analyzes NFL, NBA, MLB, NHL, and more | Offers a wide range of betting options |
| Bankroll Management | Calculates optimal stake sizes | Promotes a structured betting approach |
The software evaluates countless data points at once, uncovering patterns that manual analysis might miss. For example, betGPT merges player stats, team metrics, and historical trends to create precise NBA predictions. These features also extend to live data analysis, improving in-the-moment betting strategies.
Live Data Analysis Tools
Expanding on pre-game metrics, live data tools adjust predictions as games progress. Real-time updates on key stats allow bettors to refine their strategies mid-game.
Key features include:
- Real-Time Statistical Updates: Instant access to metrics like performance stats and score changes.
- Injury Impact Assessment: Quick insights into how player substitutions affect the game.
- Momentum Tracking: Measures and quantifies shifts in game dynamics.
These tools work hand-in-hand with pre-game analysis. For instance, betGPT's live betting features let users interpret line movements during games. When combined with metrics like Points Per Possession and Team Performance Ratings, bettors gain a well-rounded view for making informed decisions.
The most successful bettors use live insights alongside game fundamentals to make timely and effective choices.
Conclusion
Main Points Review
Predicting game outcomes effectively involves blending key metrics - like PPP, Team Ratings, PER, and BPM - with AI tools to create a well-rounded analysis.
Here’s how to bring it all together:
- Statistical Analysis: Use team and player performance data to identify trends.
- Real-Time Data: Monitor live game updates and line movements.
- Integrated Analysis: Combine stats, live insights, and odds for a comprehensive view.
While these methods offer valuable insights, they come with their own challenges.
Metric Analysis Risks
| Risk Factor | Impact | Mitigation Strategy |
|---|---|---|
| Recency Bias | Overemphasis on recent performance | Use longer historical trends for context |
| Context Gaps | Ignoring non-statistical factors | Factor in team dynamics and matchup history |
| Data Overload | Getting overwhelmed by too much data | Prioritize key predictive metrics |
| Market Efficiency | Limited value from sharp betting lines | Leverage AI to uncover rare opportunities |
To address these risks, adopt a balanced strategy that combines hard data with contextual insights. For example, when analyzing NBA games, include factors like team chemistry and rest schedules alongside quantitative metrics. Even the most advanced stats can’t replace the importance of understanding the game itself.